介绍:
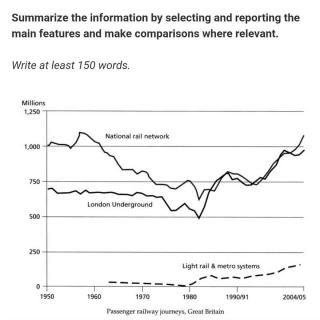
(最后一个完整例子就是封面图呀)Line graphs can be used to show how information or data changes over time. They have an x-axis (horizontal) and a y-axis (vertical). Usually, the x-axis shows the time period and the y-axis shows what is being measured. Line graphs can be used when you are plotting data that have peaks (ups) and troughs (downs). In other words, they highlight trends.
大家还在听

